Q4FY2019 Result Update | Banking
Apr 22, 2019
HDFC Bank
BUY
CMP
`2,268
Operating performance strong; improved NIM
Target Price
`2,500
Particulars (` cr)
Q4FY19
Q3FY19
% chg (qoq)
Q4FY18
% chg (yoy)
Investment Period
12 Months
NII
13,089
12,577
4.1
10,656
22.8
Pre-prov. profit
10,844
10,779
0.6
8,835
22.7
Stock Info
PAT
5,885
5,586
5.4
4,799
22.6
Source: Company, Angel Research
Sector
Banking
Market Cap (` cr)
6,23,678
HDFC Bank delivered steady performance for Q4FY2019, with PAT growth of
Beta
0.7
22.6% yoy. Pre-provision profit grew at healthy rate of 22.7% yoy, however it was
52 Week High / Low
2332/1884
lesser than previous quarter (27.6% yoy) largely owing to moderation in fee
Avg. Daily Volume
2,69,389
income. NIM improved 10bps yoy (4.4%), led by change in loan mix. The bank
Face Value (`)
2
managed to reduce its expenses and brought down the cost/income ratio from
BSE Sensex
39,140
40.6% in Q4FY2018 to 39.6 % in Q4FY2019.
Nifty
11,035
Reuters Code
HDBK.BO
Robust growth in advances; NIM register improvement: During Q4FY2019, the
Bloomberg Code
HDFCB IN
bank’s advances grew by
24.5% yoy, with retail and wholesale (including
overseas) growing at 19.4% yoy and 36% yoy respectively. The net interest income
during this period grew by 22.8% yoy, led by advances growth and improved NIM.
Shareholding Pattern (%)
Core fee income grew by just 10.9% yoy owing to reduction in MF distribution fee
Promoters
21.4
(banning of upfront commissions from Oct-18) and lower unsecured disbursement
MF / Banks / Indian Fls
13.4
affecting processing fees. Total deposits increased 17% yoy, weakest in last 5
quarters, however sequential jump of 8.3% qoq is highest in last 4 quarters. CASA
FII / NRIs / OCBs
31.2
deposits accounted for 42.4% of the total deposits.
Indian Public / Others
14.7
Strong asset quality: On the asset quality front, the bank continued to maintain
strong asset quality with a GNPA/NPA ratio of 1.36%/0.36% of loans. Total
Abs. (%)
3m 1yr
3yr
slippages for the quarter were at `3,580cr, which declined 10.5% qoq, whereas
Sensex
9.2
14.0
51.5
increased 28% yoy. PCR inched up at 71%.
HDFC Bank
9.0
18.2
109.7
Outlook & Valuation: Credit growth beat the industry growth rate driven by strong
retail business. The strong liability franchise and healthy capitalisation provides
earnings visibility. We value HDFC Bank using SOTP method, valuing standalone
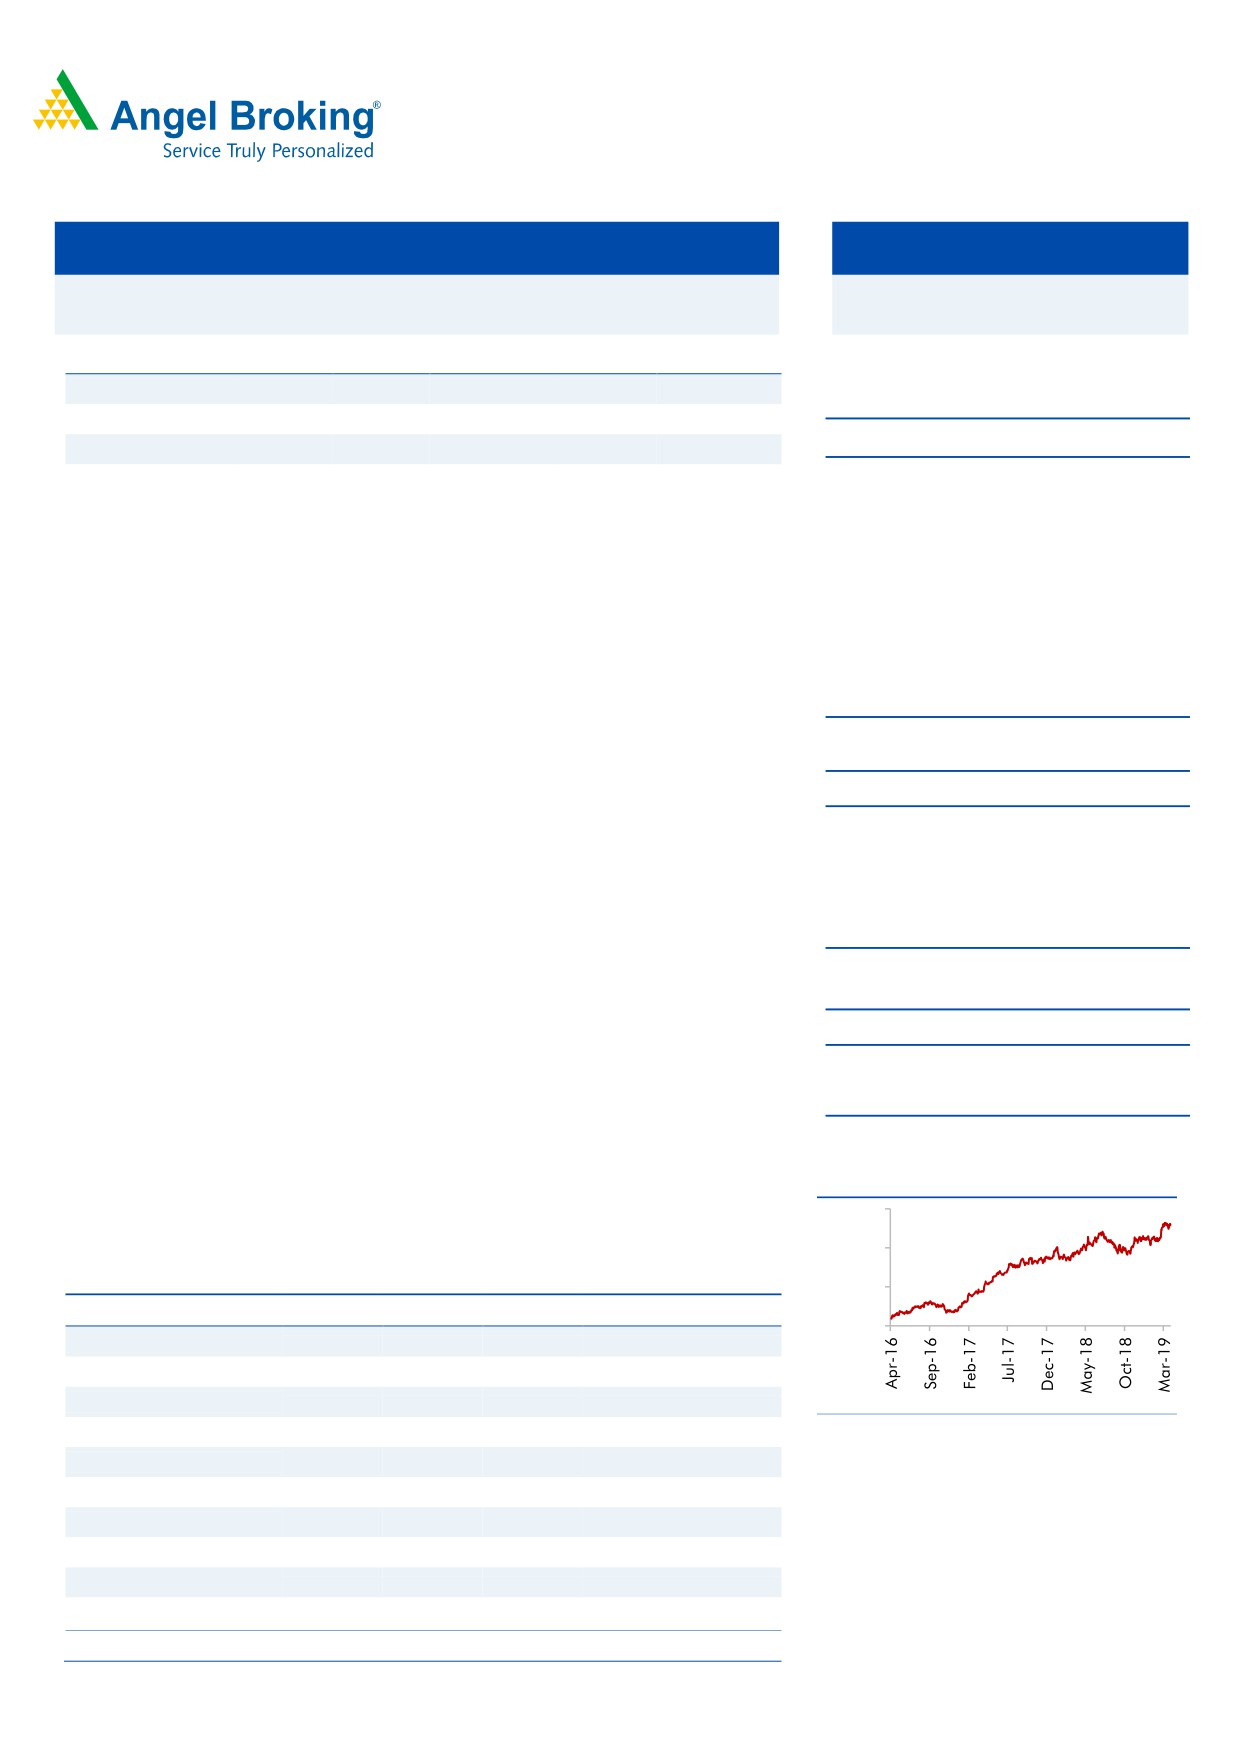
3-year price chart
banking business at 3.4x of FY21 ABV and its two subsidiaries at `135/share. We
2500
recommend a Buy on the stock, with a target price of `2,500.
2000
Key financials (Standalone)
1500
Y/E March (` cr)
FY17
FY18
FY19E
FY20E
FY21E
1000
NII
33,139
40,092
48,243
58,049
70,343
% chg
20.1
21.0
20.3
20.3
21.2
Net profit
14,549
17,486
21,078
25,611
31,312
Source: Company, Angel Research
% chg
18.3
20.2
20.5
21.5
22.3
NIM (%)
4.5
4.4
4.4
4.4
4.4
EPS ( Rs)
56.8
67.5
77.4
94.0
115.0
P/E (x)
40.3
33.9
29.6
24.4
19.9
Jaikishan Parmar
P/ABV (x)
6.9
5.6
4.3
3.8
3.3
Research Analyst
RoA (%)
022 - 39357600 Ext: 6810
1.9
1.8
1.8
1.9
1.9
RoE (%)
18.3
18.2
16.8
16.5
17.5
Note: Valuation done on 18/4/201closing rate
Please refer to important disclosures at the end of this report
1
HDFC Bank | Q4FY2019 Result Update
Exhibit 1: Quarterly Result
Particulars (` cr)
Q2FY18
Q3FY18
Q4FY18
Q1FY19
Q2FY19
Q3FY19
Q4FY19
% QoQ
% YoY
Interest earned
19,670
20,581
21,319
22,549
24,200
25,890
26,333
1.7
23.5
- on Advances / Bills
15,356
16,157
16,663
17,391
18,828
20,306
21,019
3.5
26.1
- on investments
4,006
4,100
4,222
4,589
5,042
5,319
5,047
(5.1)
19.5
- on balance with RBI & others
106
112
196
332
94
98
112
13.5
(43.1)
- on others
202
212
238
237
236
167
155
(6.8)
(34.7)
Interest Expended
9,918
10,267
10,663
11,735
12,436
13,314
13,244
(0.5)
24.2
Net Interest Income
9,752
10,314
10,656
10,814
11,763
12,577
13,089
4.1
22.8
Other income
3,606
3,868
4,229
3,818
4,016
4,921
4,871
(1.0)
15.2
- Fee & commission income
2,614
2,872
3,330
3,171
3,296
3,647
3,692
1.2
10.9
- Treasury income
356
259
(22)
(283)
(33)
474
229
(51.7)
(1,140.5)
- Forex & derivative income
384
426
416
500
420
398
403
1.4
(3.1)
Others
252
311
505
431
333
403
547
35.8
8.3
C/I%
41.5
40.4
40.6
41
39.9
38.4
39.6
122.5
(101.9)
Operating income
13,358
14,182
14,885
14,632
15,779
17,498
17,961
2.6
20.7
Operating expenses
5,540
5,732
6,050
5,984
6,299
6,719
7,117
5.9
17.6
- Employee expenses
1,716
1,691
1,741
1,811
1,909
1,968
2,074
5.4
19.1
- Other Opex
3,824
4,041
4,309
4,173
4,390
4,752
5,043
6.1
17.0
Pre-provision Profit
7,818
8,450
8,835
8,648
9,480
10,779
10,844
0.6
22.7
Provisions & Contingencies
1,476
1,351
1,541
1,629
1,820
2,212
1,889
(14.6)
22.6
PBT
6,342
7,099
7,294
7,018
7,660
8,567
8,954
4.5
22.8
Provision for Tax
2,191
2,457
2,495
2,417
2,654
2,981
3,069
3.0
23.0
PAT
4,151
4,641
4,799
4,601
5,006
5,586
5,885
5.4
22.6
Effective Tax Rate (%)
35
35
34
34
35
35
34
(52)bp
7bp
Liability Profile
Borrowing
1,01,531
1,03,867
1,23,105
1,21,024
1,42,719
1,23,460
1,17,085
(5.2)
(4.9)
Deposit
6,89,346
6,99,026
7,88,770
8,05,785
8,33,364
8,52,502
9,23,141
8.3
17.0
CA
97,825
1,01,286
1,19,283
1,09,297
1,15,131
1,11,905
1,42,498
27.3
19.5
SA
1,97,655
2,05,833
2,23,810
2,26,656
2,34,568
2,35,179
2,48,700
5.7
11.1
CASA
2,95,480
3,07,119
3,43,093
3,35,953
3,49,699
3,47,084
3,91,198
12.7
14.0
CASA%
42.9
43.9
43.5
41.7
42.0
40.7
42.4
166bp
(112)bp
CA%
14.2
14.5
15.1
13.6
13.8
13.1
15.4
231bp
31bp
SA%
28.7
29.4
28.4
28.1
28.1
27.6
26.9
(65)bp
(143)bp
NIM (Reported)%
4.3
4.3
4.3
4.2
4.3
4.3
4.4
10bp
10bp
Branches
4,729
4,734
4,787
4,804
4,825
4,963
5,103
2.8
6.6
Profitability Ratios (%)
Bps
bps
Advance Yield
10.4
10.5
10.3
10.18
10.32
10.61
10.51
(9.8)
17.0
Investment Yield
7.0
6.9
7.1
7.1
7.0
7.3
7.1
(25.9)
(3.3)
NIM Calculated
4.47
4.60
4.42
4.20
4.37
4.51
4.54
2.9
11.3
COF
5.1
5.2
5.0
5.11
5.23
5.46
5.25
(20.1)
28.0
Spread
5.2
5.3
5.4
5.1
5.1
5.1
5.3
10.3
(11.0)
RoA
1.8
1.97
1.9
1.7
1.8
1.9
1.95
4.0
4.4
RoE
16.9
17.9
18.1
17.2
16.4
15.9
16.1
16.6
(194.5)
Apr 22, 2019
2
HDFC Bank | Q4FY2019 Result Update
Exhibit 2: Advance growth & Mix (As per internal business classification)
Particulars (` cr)
Q2FY18
Q3FY18
Q4FY18
Q1FY19
Q2FY19
Q3FY19
Q4FY19
% QoQ
% YoY
Auto
78,999
82,510
85,974
88,320
91,920
93,023
91,383
(1.8)
6.3
Two Wheelers
8,535
9,220
9,648
10,324
11,290
11,369
11,271
(0.9)
16.8
CV/CE
40,361
42,548
45,939
47,167
49,548
52,880
55,429
4.8
20.7
Sub-total - Auto Loans
1,27,895
1,34,278
1,41,561
1,45,811
1,52,758
1,57,272
1,58,083
0.5
11.7
Personal Loans
61,313
67,490
72,442
78,542
84,145
89,550
93,806
4.8
29.5
Home Loans
40,029
38,130
36,265
44,036
47,875
51,799
51,372
(0.8)
41.7
Business Banking
96,485
1,00,810
1,09,507
1,09,551
1,17,039
1,20,429
1,25,014
3.8
14.2
Kisan Gold Card
31,729
31,307
35,497
33,783
37,068
36,349
40,362
11.0
13.7
Credit Cards
30,831
33,622
36,115
38,792
40,535
44,839
46,630
4.0
29.1
Others
16,493
18,061
17,791
20,362
21,023
22,403
22,771
1.6
28.0
Gold Loans
5,251
5,299
5,399
5,529
5,701
5,760
5,838
1.4
8.1
Loans against securities
3,219
3,458
3,866
3,552
3,580
3,455
3,598
4.1
(6.9)
Total Retail Advances
4,13,245
4,32,455
4,58,443
4,79,958
5,09,724
5,31,856
5,47,474
2.9
19.4
Corporate & International
1,91,622
1,98,760
1,99,890
2,28,691
2,41,114
2,49,095
2,71,927
9.2
36.0
Total loans
6,04,867
6,31,215
6,58,333
7,08,649
7,50,838
7,80,951
8,19,401
4.9
24.5
Retail
68
69
70
68
68
68
67
21.6
(40.8)
Corporate
32
31
30
32
32
32
33
(21.6)
40.8
Loan Mix
bps QoQ Bps YoY
Auto
13.1
13.1
13.1
12.5
12.2
11.9
11.2
(33.1)
(116.0)
Two Wheelers
1.4
1.5
1.5
1.5
1.5
1.5
1.4
(4.8)
(0.5)
CV/CE
6.7
6.7
7.0
6.7
6.6
6.8
6.8
17.2
3.1
Sub-total - Auto Loans
21.1
21.3
21.5
20.6
20.3
20.1
19.3
(20.6)
(113.4)
Personal Loans
10.1
10.7
11.0
11.1
11.2
11.5
11.4
26.0
77.5
Home Loans
6.6
6.0
5.5
6.2
6.4
6.6
6.3
25.7
59.2
Business Banking
16.0
16.0
16.6
15.5
15.6
15.4
15.3
(16.7)
(55.0)
Kisan Gold Card
5.2
5.0
5.4
4.8
4.9
4.7
4.9
(28.2)
(30.5)
Credit Cards
5.1
5.3
5.5
5.5
5.4
5.7
5.7
34.3
41.5
Others
2.7
2.9
2.7
2.9
2.8
2.9
2.8
6.9
0.7
Gold Loans
0.9
0.8
0.8
0.8
0.8
0.7
0.7
(2.2)
(10.2)
Loans against securities
0.5
0.5
0.6
0.5
0.5
0.4
0.4
(3.4)
(10.5)
Total Retail Advances
68.3
68.5
69.6
67.7
67.9
68.1
66.8
21.6
(40.8)
Corporate & International
31.7
31.5
30.4
32.3
32.1
31.9
33.2
(21.6)
40.8
Total loans
100.0
100.0
100.0
100.0
100.0
100.0
100.0
-
-
Asset Quality
GNPA (` Cr)
7,703
8,235
8,607
9,539
10,098
10,903
11,224
8.0
32.4
GNPA (` Cr)
2,599
2,774
2,601
2,907
3,028
3,302
3,215
9.0
19.0
GNPA%
1.3
1.3
1.3
1.3
1.33
1.38
1.36
5.0
8.0
NPA%
0.43
0.44
0.40
0.41
0.40
0.42
0.39
2.0
(2.0)
Slippage (%) Annl
1.6
2.9
1.70
2.0
2.3
2.0
1.75
(26.0)
(85.9)
Slippages
2,473
4,588
2,790
3,580
4,333
4,000
3,580
(10.5)
28.3
Credit Cost (%)
0.98
0.86
0.94
0.92
0.97
1.13
0.92
16.3
27.6
Provision Calc
65.87
66.15
69.47
69.52
69.92
69.57
71.32
(36.0)
341.1
Apr 22, 2019
3
HDFC Bank | Q4FY2019 Result Update
Outlook & Valuation: Credit growth beat the industry growth rate driven by strong
retail business. The strong liability franchise and healthy capitalisation provides
earnings visibility. We value HDFC Bank using SOTP method, valuing standalone
banking business at 3.4x of FY21 ABV and its two subsidiaries at `135/share. We
recommend a Buy on the stock, with a target price of `2,500.
Exhibit 3: Valuation Summary
Valuation
Particulars
%
Value/share (`)
Methodology
Value of HDFC Bank standalone
100
3.4x FY21E ABV
2370
Subsidiaries
HDB Fin
96%
3.5x FY21E ABV
126
HDFC Sec
98%
20x of FY21 PAT
23
Less: Cost of investments
(14)
Fair value per share
2500
Source: Company Valuation done on closing price of 18/4/19
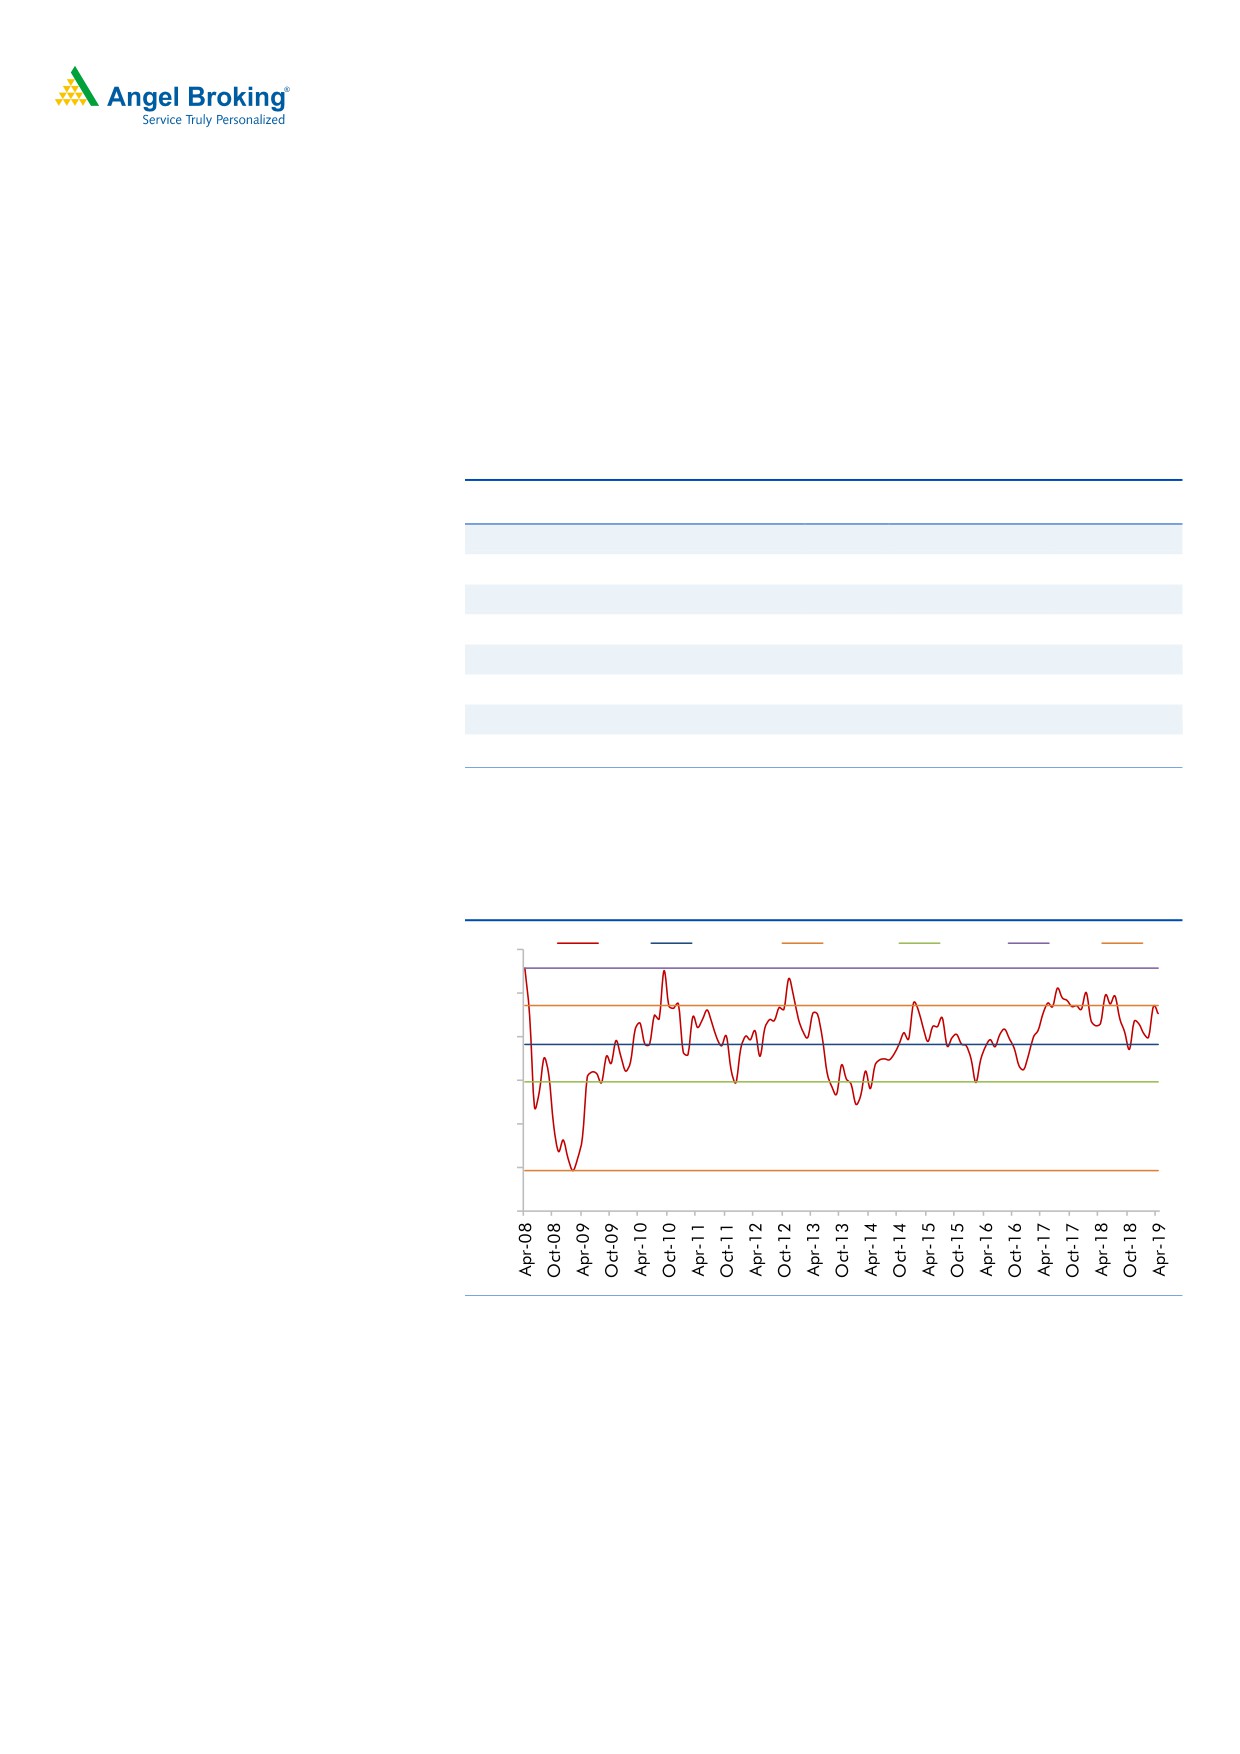
Exhibit 4: One year forward P/BV (x)
P/BV
Avg. P/BV
+1STD
-1STD
High
Low
4.5
4.28
4
3.85
3
.76
3.5
3
2.99
2.5
2
1.96
1.5
Source: Company
Apr 22, 2019
4
HDFC Bank | Q4FY2019 Result Update
Income Statement
Y/E March (` cr)
FY17
FY18
FY19E
FY20E
FY21E
Net Interest Income
33,139
40,092
48,243
58,049
70,343
- YoY Growth (%)
20.1
21.0
20.3
20.3
21.2
Other Income
12,296
15,221
17,626
20,422
23,485
- YoY Growth (%)
14.4
23.8
15.8
15.9
15.0
Operating Income
45,435
55,313
65,869
78,471
93,828
- YoY Growth (%)
18.5
21.7
19.1
19.1
19.6
Operating Expenses
19,703
22,690
26,119
30,540
35,708
- YoY Growth (%)
16.0
15.2
15.1
16.9
16.9
Pre - Provision Profit
25,732
32,623
39,750
47,931
58,120
- YoY Growth (%)
20.4
26.8
21.8
20.6
21.3
Prov. & Cont.
3,593
5,927
7,550
9,706
11,386
- YoY Growth (%)
31.8
65.0
27.4
28.6
17.3
Profit Before Tax
22,139
26,696
32,200
38,225
46,735
- YoY Growth (%)
18.8
20.6
20.6
18.7
22.3
Prov. for Taxation
7,589
9,210
11,122
12,614
15,422
- as a % of PBT
34.3
34.5
34.5
33.0
33.0
PAT
14,549
17,486
21,078
25,611
31,312
- YoY Growth (%)
18.3
20.2
20.5
21.5
22.3
Balance Sheet
Y/E March (` cr)
FY17
FY18
FY19E
FY20E
FY21E
Share Capital
513
518
545
545
545
Reserves & Surplus
85,502
1,05,776
1,44,360
1,65,351
1,91,884
Net Worth
86,014
1,06,294
1,44,905
1,65,896
1,92,429
Deposits
6,43,640
7,88,770
9,23,141
11,07,769
13,29,323
- Growth (%)
17.8
22.5
17.0
20.0
20.0
Borrowings
74,029
1,23,105
1,17,085
1,66,165
1,99,398
Other Liab & Prov.
56,709
45,764
55,108
66,466
79,759
Total Liabilities
8,60,392
10,63,933
12,40,239
15,06,296
18,00,909
Cash balances
37,897
1,04,670
46,764
60,927
73,113
Bank balances
11,055
18,244
34,584
17,724
21,269
Investments
2,14,463
2,42,200
2,90,588
3,65,564
4,38,677
Advances
5,54,568
6,58,333
8,19,401
9,99,669
12,19,597
- Growth (%)
19.4
18.7
24.5
22.0
22.0
Fixed Assets
3,627
3,607
4,030
6,868
8,242
Other Assets
38,782
36,879
44,873
55,543
40,012
Total Assets
8,60,392
10,63,933
12,40,239
15,06,296
18,00,909
- Growth (%)
21.4
23.7
16.6
21.5
19.6
Apr 22, 2019
5
HDFC Bank | Q4FY2019 Result Update
Key Ratio
Y/E March
FY17
FY18
FY19E
FY20E
FY21E
Profitability Ratios (%)
NIMs
4.5
4.4
4.4
4.4
4.4
Cost to Income Ratio
43.4
41.0
39.7
38.9
38.1
RoA
1.9
1.8
1.8
1.9
1.9
RoE
18.3
18.2
16.8
16.5
17.5
B/S ratios (%)
CASA Ratio
48.0
43.5
42.4
45.0
45.0
Credit/Deposit Ratio
86.2
83.5
88.8
90.2
91.7
Asset Quality (%)
Gross NPAs
1.1
1.3
1.3
1.3
1.3
Net NPAs
0.3
0.4
0.4
0.4
0.4
Slippages
1.5
1.5
2.2
2.0
2.0
Loan Loss Prov./Avg. Assets
0.6
0.9
0.9
1.0
0.9
Provision Coverage
69
69
69
69
69
Per Share Data (`)
EPS
56.8
67.5
77.4
94.0
115.0
BVPS
336
410
532
609
707
ABVPS
334
407
528
605
701
DPS
11.5
13.5
13.5
14.5
15.0
Valuation Ratios
PER (x)
40.3
33.9
29.6
24.4
19.9
P/BVPS (x)
6.8
5.6
4.3
3.8
3.2
P/ABVPS (x)
6.9
5.6
4.3
3.8
3.3
Dividend Yield
0.5
0.6
0.6
0.6
0.7
DuPont Analysis (%)
Interest Income
8.83
8.34
8.59
8.97
9.07
Interest Expenses
4.61
4.17
4.40
4.75
4.82
NII
4.22
4.17
4.19
4.23
4.25
Non Interest Income
1.57
1.58
1.53
1.49
1.42
Total Revenues
5.79
5.75
5.72
5.71
5.67
Operating Cost
2.51
2.36
2.27
2.22
2.16
PPP
3.28
3.39
3.45
3.49
3.51
Total Provisions
0.46
0.62
0.66
0.71
0.69
Pre-Tax Profit
2.82
2.77
2.79
2.78
2.83
Tax
0.97
0.96
0.97
0.92
0.93
ROA
1.85
1.82
1.83
1.86
1.89
Leverage
9.89
10.01
9.17
8.84
9.23
RoE (%)
18.34
18.19
16.78
16.48
17.48
Source: Company Valuation done on closing price of 18/4/19
Apr 22, 2019
6
HDFC Bank | Q4FY2019 Result Update
Research Team Tel: 022 - 39357800
DISCLAIMER
Angel Broking Limited (hereinafter referred to as “Angel”) is a registered Member of National Stock Exchange of India Limited, Bombay
Stock Exchange Limited, Metropolitan Stock Exchange Limited, Multi Commodity Exchange of India Ltd and National Commodity &
Derivatives Exchange Ltd It is also registered as a Depository Participant with CDSL and Portfolio Manager and Investment Adviser with
SEBI. It also has registration with AMFI as a Mutual Fund Distributor. Angel Broking Limited is a registered entity with SEBI for Research
Analyst in terms of SEBI (Research Analyst) Regulations, 2014 vide registration number INH000000164. Angel or its associates has not
been debarred/ suspended by SEBI or any other regulatory authority for accessing /dealing in securities Market. Angel or its
associates/analyst has not received any compensation / managed or co-managed public offering of securities of the company covered
by Analyst during the past twelve months.
This document is solely for the personal information of the recipient, and must not be singularly used as the basis of any investment
decision. Nothing in this document should be construed as investment or financial advice. Each recipient of this document should
make such investigations as they deem necessary to arrive at an independent evaluation of an investment in the securities of the
companies referred to in this document (including the merits and risks involved), and should consult their own advisors to determine
the merits and risks of such an investment.
Reports based on technical and derivative analysis center on studying charts of a stock's price movement, outstanding positions and
trading volume, as opposed to focusing on a company's fundamentals and, as such, may not match with a report on a company's
fundamentals. Investors are advised to refer the Fundamental and Technical Research Reports available on our website to evaluate the
contrary view, if any
The information in this document has been printed on the basis of publicly available information, internal data and other reliable
sources believed to be true, but we do not represent that it is accurate or complete and it should not be relied on as such, as this
document is for general guidance only. Angel Broking Limited or any of its affiliates/ group companies shall not be in any way
responsible for any loss or damage that may arise to any person from any inadvertent error in the information contained in this report.
Angel Broking Limited has not independently verified all the information contained within this document. Accordingly, we cannot testify,
nor make any representation or warranty, express or implied, to the accuracy, contents or data contained within this document. While
Angel Broking Limited endeavors to update on a reasonable basis the information discussed in this material, there may be regulatory,
compliance, or other reasons that prevent us from doing so.
This document is being supplied to you solely for your information, and its contents, information or data may not be reproduced,
redistributed or passed on, directly or indirectly.
Neither Angel Broking Limited, nor its directors, employees or affiliates shall be liable for any loss or damage that may arise from or in
connection with the use of this information.
Disclosure of Interest Statement
HDFC Bank
1. Financial interest of research analyst or Angel or his Associate or his relative
No
2. Ownership of 1% or more of the stock by research analyst or Angel or associates or relatives
No
3. Served as an officer, director or employee of the company covered under Research
No
4. Broking relationship with company covered under Research
No
Ratings (Based on expected returns
Buy (> 15%)
Accumulate (5% to 15%)
Neutral (-5 to 5%)
over 12 months investment period):
Reduce (-5% to -15%)
Sell (< -15)
Apr 22, 2019
7